
Stock Analysis: Tutor Perini
Here's my analysis on Tutor Perini Corporation, including my price target.

My buddy over at The Daily $pread is a big fan of the Tutor Perini Corporation (TPC), which is up 8.7% so far today. I thought I would write up an article with my analysis of the company. I do like the business, but I never got the chance to buy in when it was closer to its lows. I may consider adding some to my portfolio soon, however. Also, this article is not financial advice. Without further ado, let’s get into it.
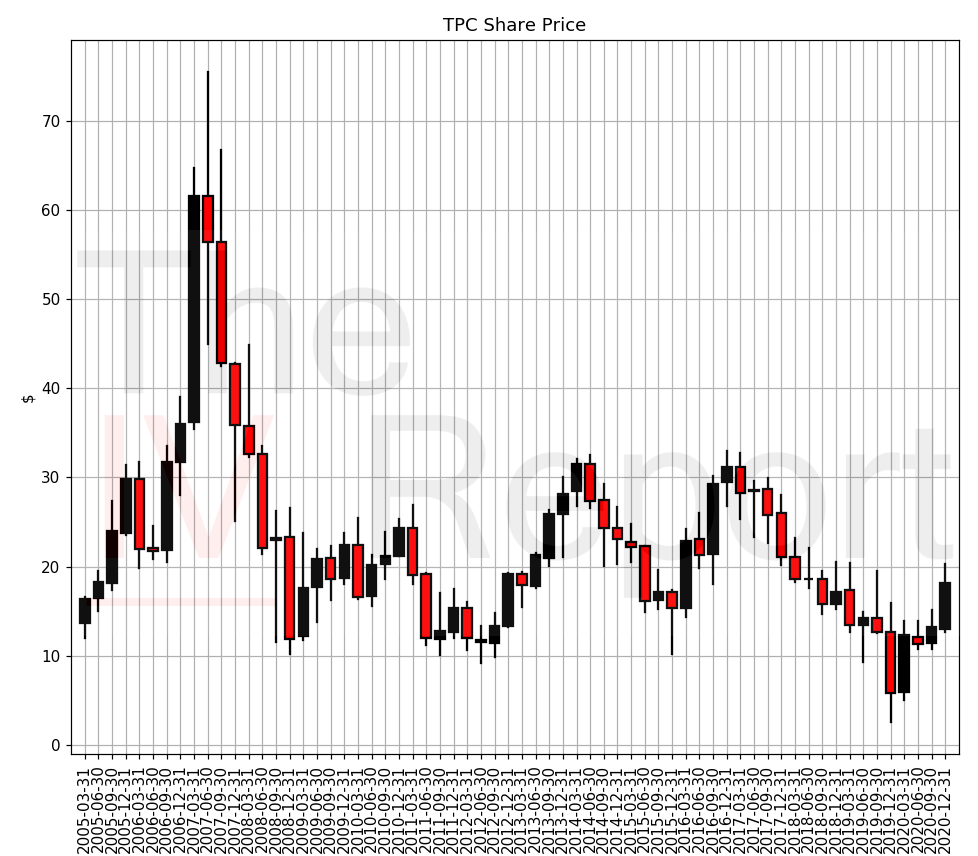
The TPC share price is plotted in Figure 1 below. The main action here is the channel that the stock has been in since the 2008 crash. We will come back to this channel at the end of the article. Currently, the stock is still rising from its COVID lows.
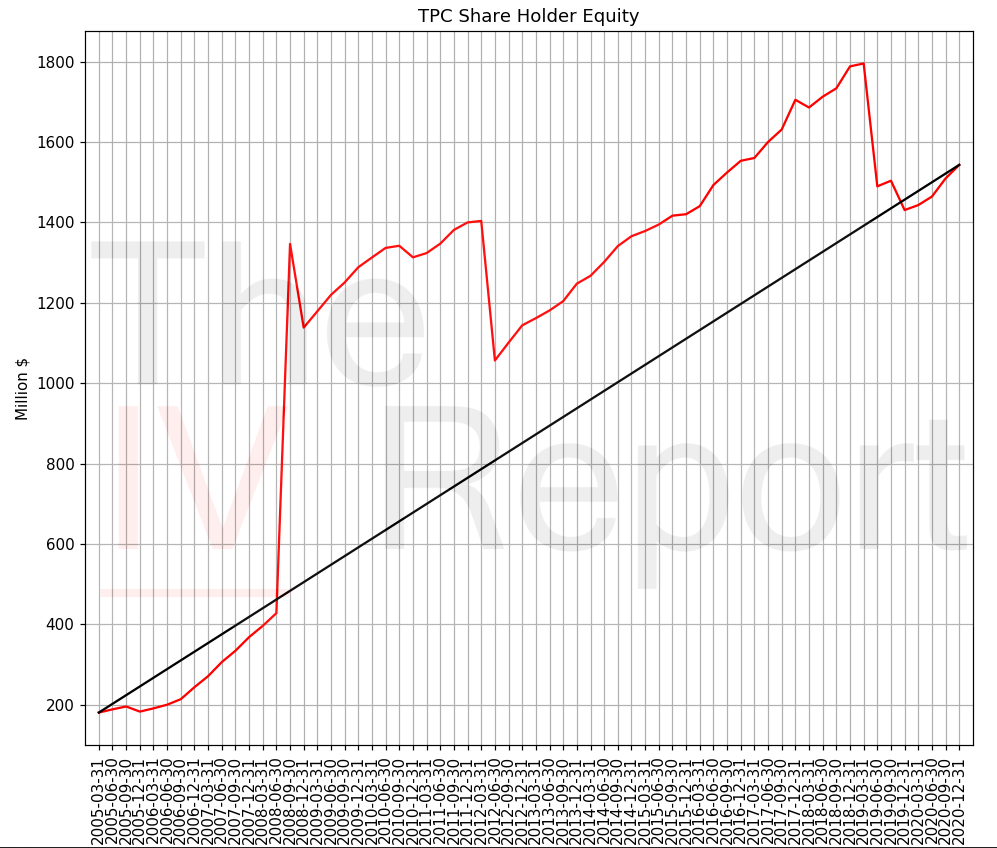
To get the intrinsic value of TPC, we need to model the future increases in its share holder equity and its future dividends, as I described in my value investing article. TPC does not pay a dividend, so we will ignore it and only look at the share holder equity. It is plotted in red in Figure 2. Just like most other stocks, the most appropriate model for TPC’s share holder equity is a linear one, which I have plotted in black. Now, the actual line does not matter here for our IV calculation. It is just there for comparison with the reported data. Only the slope is used; here, the slope is $21.6 million per quarter.
Now we can calculate the intrinsic value. In the case where the book value grows by the slope value I indicated above, we get an IV of about $35 per share. Of course, the book value may not continue on the current trajectory, so I calculate a few other scenarios as well. If the company does not grow its book at all, its IV would be around $30. If the company actually shrinks its book at a rate of $21.6 million per quarter, then its IV would be around $25 per share. If a disaster happens and the company loses 30% of its book value overnight - something like what happened in 2011 - then the IV would be $27 if the current growth continues after that, or $16 if the negative of the current growth happened after that (this latter calculuation is my “catastrophe” scenario - big drop in book value followed by negative growth).
So which of these calculations do I think is the most realisitic for my price target? Generally, it is the linear “trend continuation scenario.” We can convince ourselves of this by consulting the price-to-book ratio, which I have plotted in Figure 3.
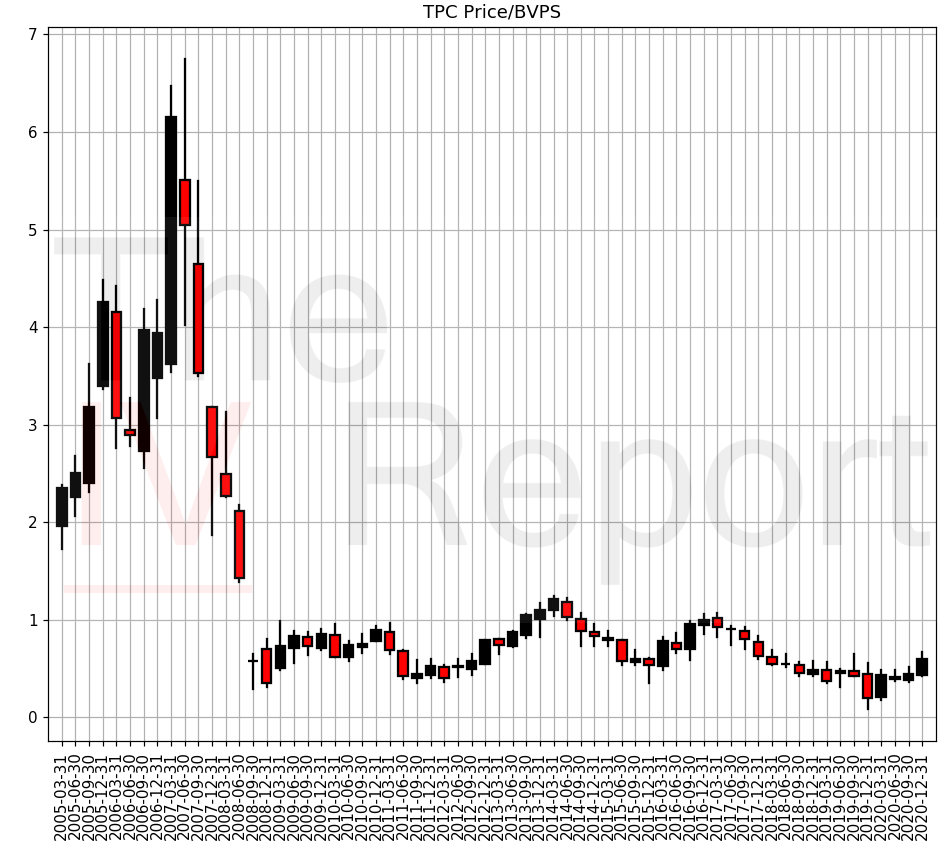
Over the last 12 or so years, the PB ratio has peaked around 1.25. If the price were to reach my IV of $35, it would represent a PB of 1.2. Thus, I think $35 is an appropriate price target for TPC. Of course, if TPC were to reach $35, it would break through the channel in Figure 1 that I discussed. My guess is that at that point, the ridiculously bullish technicals would drive further buying and push the price even higher. If I were trading this stock (which I probably will be at some point), I would almost certainly hold some TPC past my price target and wait for the speculative demand to kick in and take it higher.
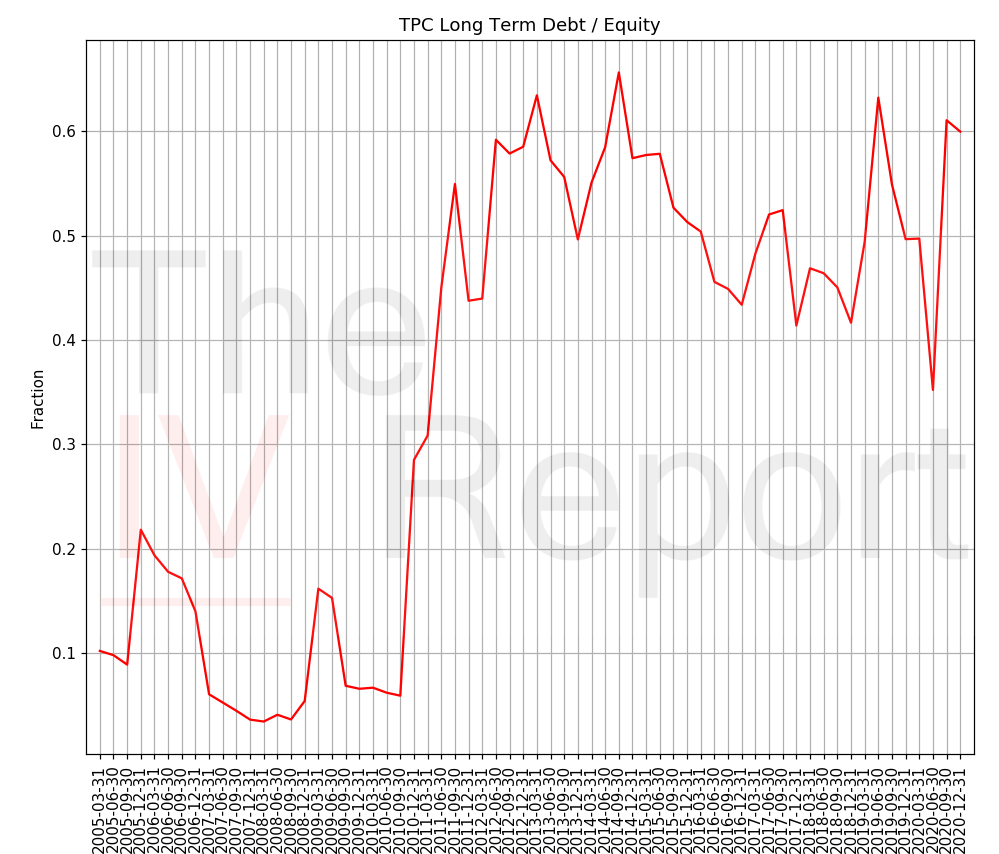
Worries: The only reservation I have here is that the long-term debt-to-equity ratio is climbing; see Figure 4. I do not like buying companies with large amounts of debt. Further, the book value trend for TPC is not as solid as I usually like. Things like that can keep me up at night before earnings reports. I will continue to monitor it for any surprises.
That’s all for this short analysis article! If you enjoyed it, don’t forget to join my newsletter (for free) or subscribe (for $5 per month)! Subscribers get access to my portfolio updates (part 1 and part 2 here; part 3 coming soon), which include tons of analysis just like this on a wide range of stocks. I have a limited-time offer of a 30 day free trial of my paid tier here if you want to take a look. Also follow me on Twitter and YouTube for more content there! See you next time!